Note detection project approach description
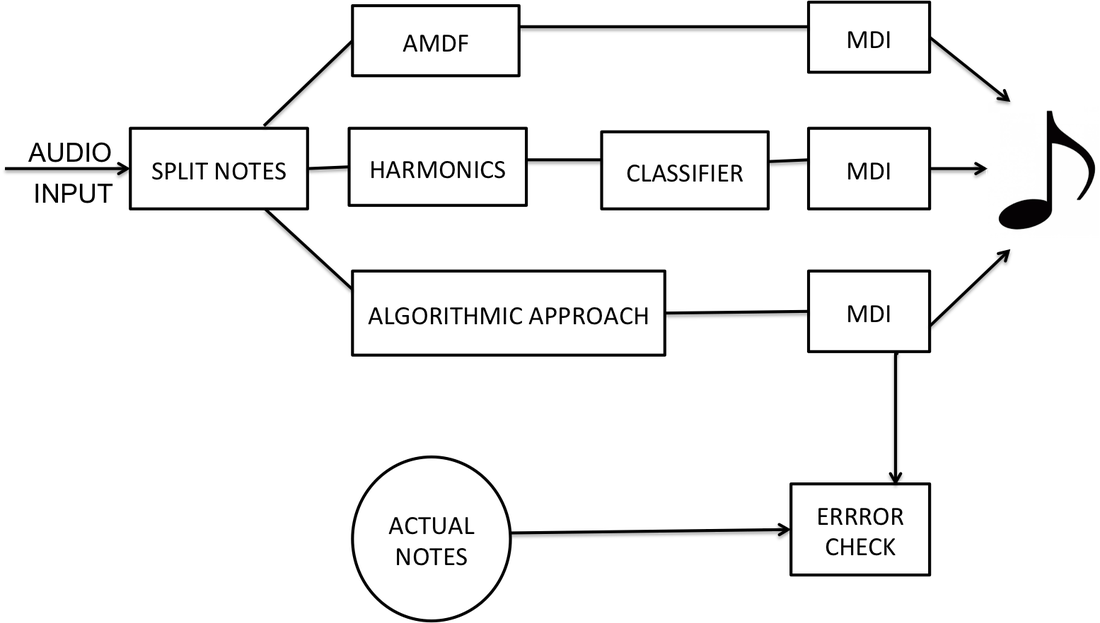
The block diagram shown below gives a quick summary of the logic behind our project. There are many ways we could have implemented the algorithm of converting audio music file to a notes that can be printed on the stuff. However, the general idea comprised of analyzing the audio music in both time and frequency domain.
I. Analysis in time domain
Splitting notes: Note duration
After collecting the data, we applied a butterworth filter to cut off unwanted frequencies outside the range of interest. We then plotted this signal in time domain to get initial idea of how the signal changes over time. We analyzed some of the recordings and realized that every time a new note is played, the instensity peaks and decreases gradually . We decided to use this information to get the duration of a single note. We implemented this by picking the point where intensity starts peaking and end where the intensity peaks again. This distance between the two intensity peaks determine the duration of a note. In the block diagram, split notes represent a function that takes the audio signal after filtering and divide it into smaller segments of varying wondows according to intensity peaks. The small segments represent individual notes. To get note durations printed on the staff, we treated the smallest duration as an eighth note and used it a base reference. If a certain duration is 8 times the smallest segments, it is considered a whole note, 4 times is a half note, 2 times is quarter note, etc. Thus, cutting the audio signal into small segments based on highest peak intensities helped us to isolate individual notes and provide a basis to determine time duration. This method is described further in the DSP tools as segmentation.
After collecting the data, we applied a butterworth filter to cut off unwanted frequencies outside the range of interest. We then plotted this signal in time domain to get initial idea of how the signal changes over time. We analyzed some of the recordings and realized that every time a new note is played, the instensity peaks and decreases gradually . We decided to use this information to get the duration of a single note. We implemented this by picking the point where intensity starts peaking and end where the intensity peaks again. This distance between the two intensity peaks determine the duration of a note. In the block diagram, split notes represent a function that takes the audio signal after filtering and divide it into smaller segments of varying wondows according to intensity peaks. The small segments represent individual notes. To get note durations printed on the staff, we treated the smallest duration as an eighth note and used it a base reference. If a certain duration is 8 times the smallest segments, it is considered a whole note, 4 times is a half note, 2 times is quarter note, etc. Thus, cutting the audio signal into small segments based on highest peak intensities helped us to isolate individual notes and provide a basis to determine time duration. This method is described further in the DSP tools as segmentation.
II. Frequency domain analysis
Frequency domain analysis involved mostly short time fourier analysis of the signal. Spectrogram of the signal would generally give an idea of frequency and time domain components of the signal. However, the spectrogram of the whole signal could not be helpul in terms of using matlab code to identify individual notes instead we took the short time fourier transform of the small windows (small pieces cut according to the discussion above) that we assume to be comprise solely by a single fundamental note and its harmonics. Generally a music note is comprised of a fundamental frequency and its integer multiples called harmonics as shown in this formula
Fn = n. Fo with n = 1,2,3,...
Fo: fundamental frequency
Fn: Harmonic frequency
Thus, by implementing different algorithms, we could identify the fundamental frequency which generally the dominant frequency.
As shown in the block diagram, we implemented three approaches to identify the fundamental frequency of the note, which is in fact the one that determines what note is being played. We tried three methods to accurately detect the fundamental frequency:
Approach 1: Algorithmic approach
Lowest Frequency with intensity above the threshold Vs frequency with maximum intensity
This approach relied mainly on the short-time fourier transform using fft matlab tool. After taking fft of the small window that correspond to a single note, we started by defining a certain threshol which any frequency with an amplitude intensity less than this is considered a noise and is set to zero. The remaining non zero intensity frequencies are evaluated and we pick the lowest frequency to be the fundemental. The problem with this approach is that it is hard to find an appropriete threshold since the recordings might be done in different environments and sound intensity might be changing. It is also possible to pick a harmonic with lower frequency than fundamental as in case of flute or may be pick up the noise frequency if its intensity is above the threshold value. Another alternative that we tried in earlier stage of this project is using the frequency with maximum intensity as the fundamental frequency. Generally, the fundamental frequency have the highest frequency, however, this is not always the case. Sometimes, some note tons possess a harmonic stronger(higher intensity) than the fundamental frequency. Although, we tried all this approaches, none of them proved to be more effective and accurate than the other approaches discussed later. Generally, the main issue with this approach is that there is no reliable method to eliminate noises and get rid of unwanted harmonics.
This approach relied mainly on the short-time fourier transform using fft matlab tool. After taking fft of the small window that correspond to a single note, we started by defining a certain threshol which any frequency with an amplitude intensity less than this is considered a noise and is set to zero. The remaining non zero intensity frequencies are evaluated and we pick the lowest frequency to be the fundemental. The problem with this approach is that it is hard to find an appropriete threshold since the recordings might be done in different environments and sound intensity might be changing. It is also possible to pick a harmonic with lower frequency than fundamental as in case of flute or may be pick up the noise frequency if its intensity is above the threshold value. Another alternative that we tried in earlier stage of this project is using the frequency with maximum intensity as the fundamental frequency. Generally, the fundamental frequency have the highest frequency, however, this is not always the case. Sometimes, some note tons possess a harmonic stronger(higher intensity) than the fundamental frequency. Although, we tried all this approaches, none of them proved to be more effective and accurate than the other approaches discussed later. Generally, the main issue with this approach is that there is no reliable method to eliminate noises and get rid of unwanted harmonics.
Approach 2: Average Magnitude Difference Function autocorrelation (AMDF)
A second approach we used is AMDF autocorrelation. This autocorrelation is a DSP tool that we learned outside the class and we found an open source matlab code that estimate the fundamental frequency given a piece of recording that contains only one note. In our project we feed this function the small pieces that represent a single note and let it estimate the right fundamental frequency. A summary of what we learned about AMDF autocorrelation can be found here. The open source code for this function can also be found here.
Approach 3: Classifiers
This approach makes use of machine learning tools found in matlab called classifiers. What we did was to record training data and train a classifier to recorgnize notes that lies within the range of the training data ( C4 to C6). We trained all classifiers and picked ones that provide good percent accuracy and test them. It worth mentioning that the training data contains just the fundemantal frequency and the second most dominant harmonic ( harmonic with highest amplitude intensity) picked from the recorderded training data by using harmonics function shown in the block diagram.
III. Printing notes on the staff
Our signal processing project is able to take in an audio recording and then convert it into a vector of MIDI values and note durations using a variety of different approaches. After we have the midi values, we want to be able to print the calculated notes onto sheet music. In order to accomplish this goal of creating a nice final graphic, we are using an open source MATLAB function found here. Originally, this code took in 3 input parameters: a midi vector, a duration vector, and a character to specify printing of flats or sharps. We have since modified the open source code to take in a single input parameter: a vector with 1 row for midi values and a 2nd row for note duration. Using this modified note printing code, we are able to create sheet music for all three sets of notes that we calculating using our three different note detection methods.
IV. Error check
Finally, for checking the performance of our program, we used melodies that we know their note components and input them as the theoretical notes and compare them to the output of our function to find out the percentage accuracy of the program. Currently, our program uses two approaches described earlier, the AMDF and Classifier to detect a note that is being played. That is the error check function provides the percent accuracy based on AMDF algorithm and Percent accuracy based on classifiers. This way we could compared them at the end and see which one provides highest percent accuracy note detection.
