TIME DOMAIN |
FREQUENCY DOMAIN |
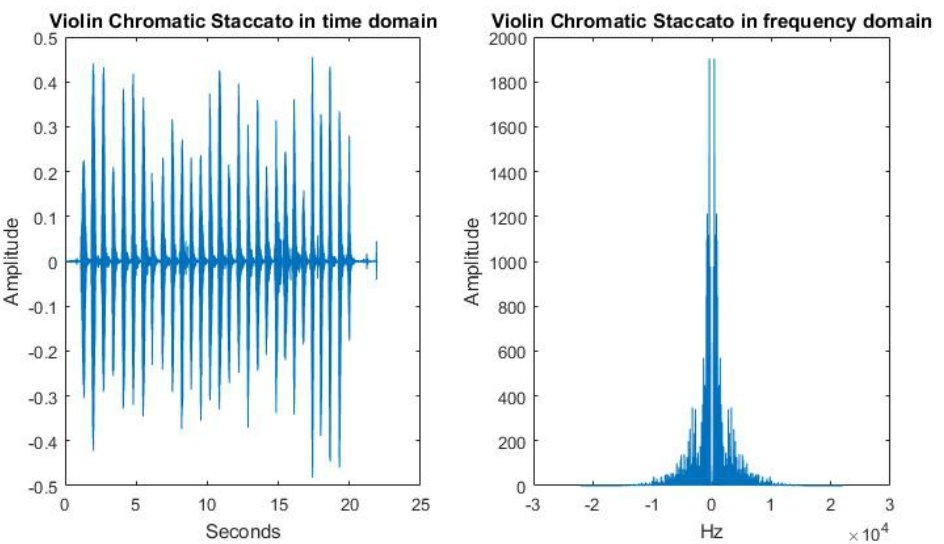
TIME AND FREQUENCY DOMAIN PLOTS
This is just an example of what a musical scale looks like in Time Domain and in Frequency Domain. The notes here have been played separately (staccato).
Time Domain
- Each peak corresponds to a played note -> Easy to separate them and get individual notes
- The amplitude of the peaks represents the intensity (volume) -> It is not useful for the note identification
Frequency Domain
- Each peak corresponds to a frequency component -> Each component is the sum of the power for all the notes in the scale
- It is not filtered -> We will implement a Butter-worth Filter later on.
- It is not possible to identify the notes from this plot either.
What can we do? Combine these two plots in ONE! -> Spectrogram
