Main Frequency and Harmonic Detection
This algorithm is used to produce training data for creating the classifiers and predicting data to use on the classifiers. It reduces a large noisy signal to main frequencies and the strongest harmonic.
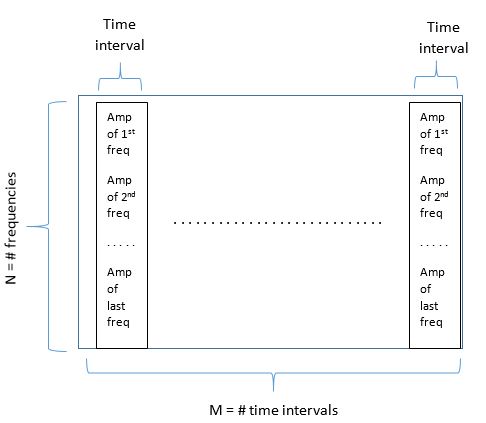
The input to this algorithm is a matrix representation of spectrogram data. It includes the amplitudes of frequencies in a frequency range over many time intervals.
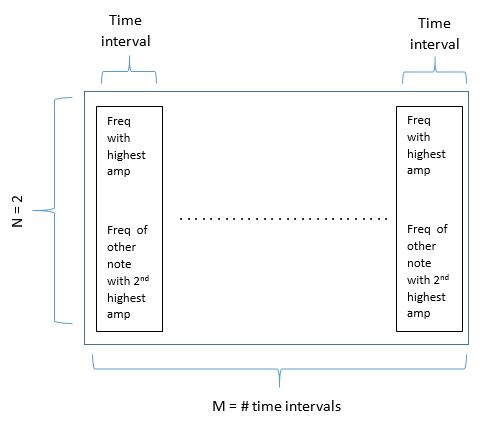
The output of this algorithm is a 2-row matrix with 2 frequency values (main and strongest harmonic) for each time interval. Because a harmonic can sometimes be stronger than the main frequency, we wanted the algorithm to characterize notes based on two characteristics. Only using the strongest frequency would cause harmonics to mislead our detection program.
Input Output
The input to this algorithm is a matrix representation of spectrogram data. It includes the amplitudes of frequencies in a frequency range over many time intervals.
The output of this algorithm is a 2-row matrix with 2 frequency values (main and strongest harmonic) for each time interval. Because a harmonic can sometimes be stronger than the main frequency, we wanted the algorithm to characterize notes based on two characteristics. Only using the strongest frequency would cause harmonics to mislead our detection program.
Input Output
|
|
This algorithm uses the MATLAB findpeaks function to detect the local maximums. Once obtaining several frequencies of relatively maximum amplitudes, the algorithm aims to extract the main frequency and its strongest harmonic. First the algorithm finds the frequency with the maximum amplitude. This is likely the main frequency but could also be a strong harmonic. Then it iterates through the remaining frequencies from strongest to weakest to find the next frequency. This is likely the stongest harmonic but is possibly the main frequency. The algorithm identifies the next frequency as the strongest frequency a certain distance away from the maximum. If it was too close to the maximum, it was probably noise from the same note, not a different note.
The two frequencies are used to train a classifier and also condition test data. See the approach block diagram for how this "Harmonics" algorithm fits into the rest of the detection program.
